Contributors
F. Börrnert, J. Biskupek, U. Kaiser
Lithium ion batteries are the subject of vibrant research nowadays. To enhance their performance, the microscopic mechanisms when charging or uncharging a battery need to be understood in detail. Graphite is widespread as active electrode material in lithium ion batteries. It can accommodate up to one lithium atom per six carbon atoms (LiC6) in the space between its constituting graphene sheets. Increasing in-situ transmission electron microscopy (TEM) efforts have been devoted towards imaging the lithiation of these electrodes, but so far in-situ imaging never approached the atomic resolution level.
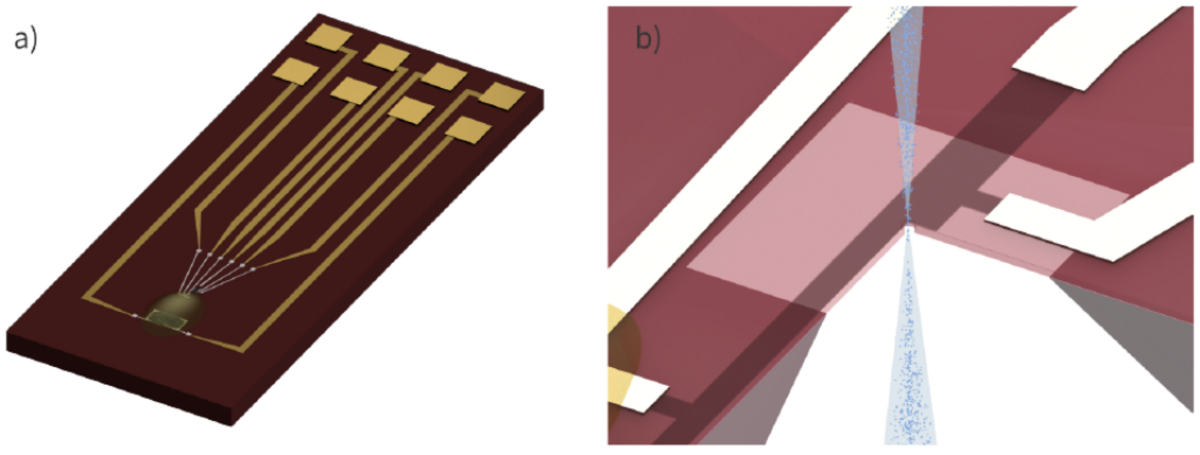
In order to elucidate the real-time dynamics of how lithium is incorporated into graphitic electrodes at the atomic level, we designed and conducted an in-situ TEM experiment. The electrode model was reduced to just two layers of graphite, i. e., bilayer graphene. The lithium dynamics when charging or discharging the bilayer graphene has been extensively studied by our collaborators recently [1]. The whole electrical setup for controlled lithiation and delithiation was prepared on a custom designed chip fitting into a commercial TEM sample holder with eight electrical feed-throughs, see figure 1 for a schematic of this chip.
Because of the extremely low interaction cross-section of lithium, we use the geometrical and chromatic aberration-corrected low-voltage SALVE instrument for in-situ imaging [2]. The use of 80 kV electron acceleration voltage ensures that the bilayer graphene stays intact and the chromatic aberration correction offers sufficient contrast for imaging lithium at atomic resolution.
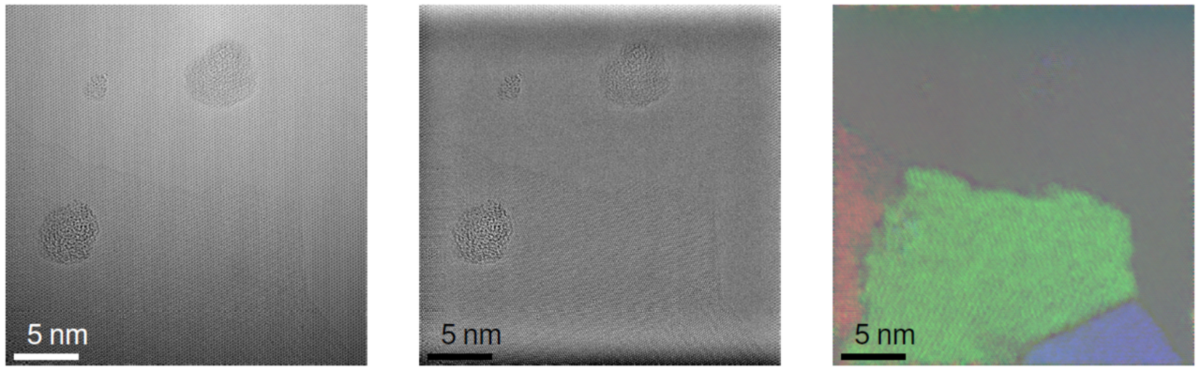
In the experiments, we find a dense, a few layers thick lithium crystal growing reversibly between the graphene sheets, controllable by electrical biasing. Figure 2 shows a single frame out of a time series during lithiation. On the left, the raw image is shown, in the middle, the graphene lattice is filtered away, and on the right, three different orientations of the growing crystallites are colored. Electron energy-loss spectroscopy also performed in situ does not reveal any other element than lithium and carbon. The expected C6LiC6 (for bilayer graphene) was not observed. Density functional theory calculations confirm a similar formation energy for the hcp phase as was found for C6LiC6.
[1] M. Kühne et al., Ultrafast lithium diffusion in bilayer graphene. Nat. Nanotech. 12, 895–900 (2017).
[2] M. Linck et al., Chromatic aberration correction for atomic resolution TEM imaging from 20 to 80 kV. Phys. Rev. Lett. 117, 076101 (2016).
F. Börrnert, J. Biskupek, U. Kaiser
| Dr. J. Smet (MPI für Festkörperforschung, Stuttgart) |
| Dr. Arkady Krasheninnikov (HZDR, Dresden) |
Baden-Württemberg Stiftung in the frame of the CleanTech program