Statistical Visualization of Bibliographic Information
The statistical visualization tool can either deal with particular user-defined retrieval results (click the column chart icon in the hitlist) or with the dataset of the complete database file.
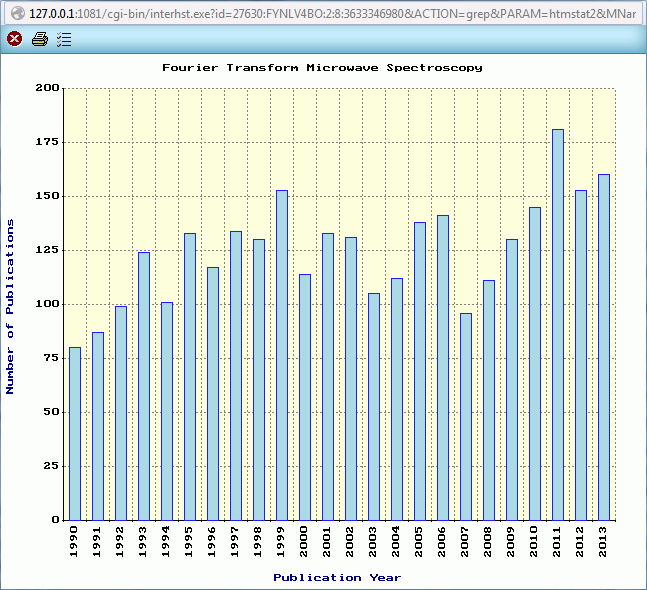
The histogram is an example for the first case. It displays the distribution of publications in the field of Fourier transform microwave spectroscopy over the last 2 decades. The display is based on the retrieval of the publication year interval between 1990 and 2013 and the keyword search FOURIERMW+NT, combined by the Boolean operator AND. Here FOURIERMW is the acronym of the corresponding keyword. The relationship code NT ("narrow term") automatically includes all more specific keywords of the given item, in this case "Fourier transform microwave spectroscopy of molecular beams", etc.
Back: Single Bibliographic Documents
Next: Compound Search Mask