Statistical Visualization of Compound Information
The statistical visualization tool can either deal with particular user-defined retrieval results or with the dataset of the complete database file*.
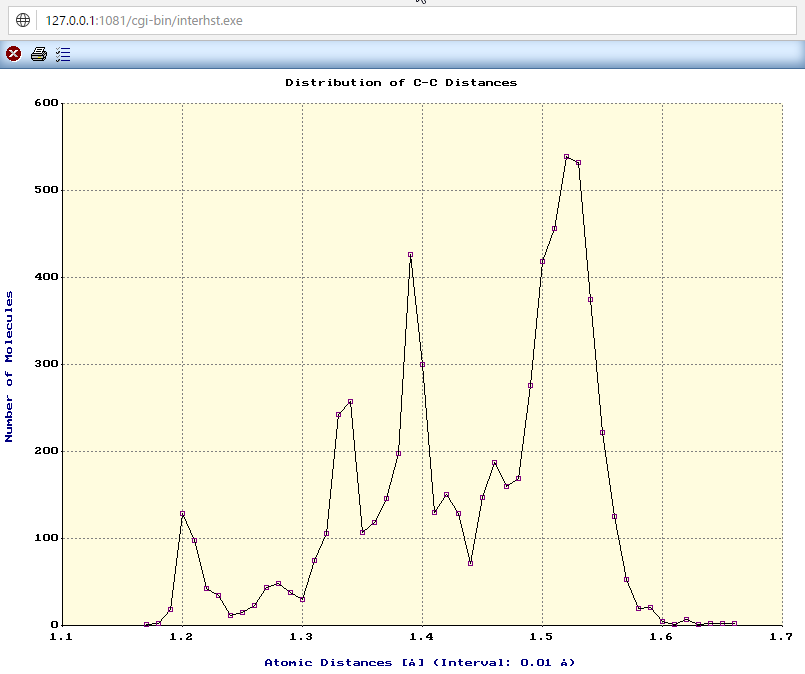
The scatter chart above is an example for the second case. Without any retrieval all C-C internuclear distances of the complete MGDCOM file are taken into account. The main peaks at 1.20 Å, 1.33 Å, 1.39 Å and 1.52 Å can be assigned to acetylenic triple bonds, olefinic double bonds, aromatic bonds and aliphatic single bonds, respectively.
See also:
compound search mask
compound hitlist
Back: Single Compound Documents
End of Guided Tour
*On the navigator page click on the second icon ("Document Browsing") and then on the bar chart icon.