Statistical Analysis of Spatial Point Patterns - Research Training Group 1100
The goal of the research training group 1100 is the investigation of economical problems using mathematical modeling, analysis and simulation. The problems are developed in collaberation with partners from outside the university and cover the following subjects:
- Valuation of complex financial products
- Risk analysis and management
- Optimal strategies
- Econometric analysis and strategies
- Knowledge discovery and data mining
In order to solve these problems, the participants emphasize on the following topics of mathematical research:
- Stochastical models, their analysis and simulation
- Statistical inference and data analysis
- Stochastical controls and optimization
- Partial differential equations and functional analysis
- Financial mathematical modeling and analysis
- Numerical analysis and simulation
- Methods of software development and of software quality management
So far the Institute of Stochastics has developed and implemented several methods from spatial statistics concerning point pattern analysis. The underlying models of stochastic geometry are (marked) point processes in R2 and R3. The implementation of efficient edge corrected estimators for characteristics of point processes in 2D as well as in 3D is an important aspect of the present work. That includes, among other things, the pair correlation function, Ripley's K function, the nearest neighbor distance distribution function, the mark correlation function and the distance-dependant Simpson indices. In addition to that simulation-based Monte Carlo tests were developed and implemented. In several interdisciplinary projects these methods have been used and resulted in publications with scientists from many different fields of research. Besides the purely descriptive statistical analysis of point patterns, fitting point process models to given data was also an issue.
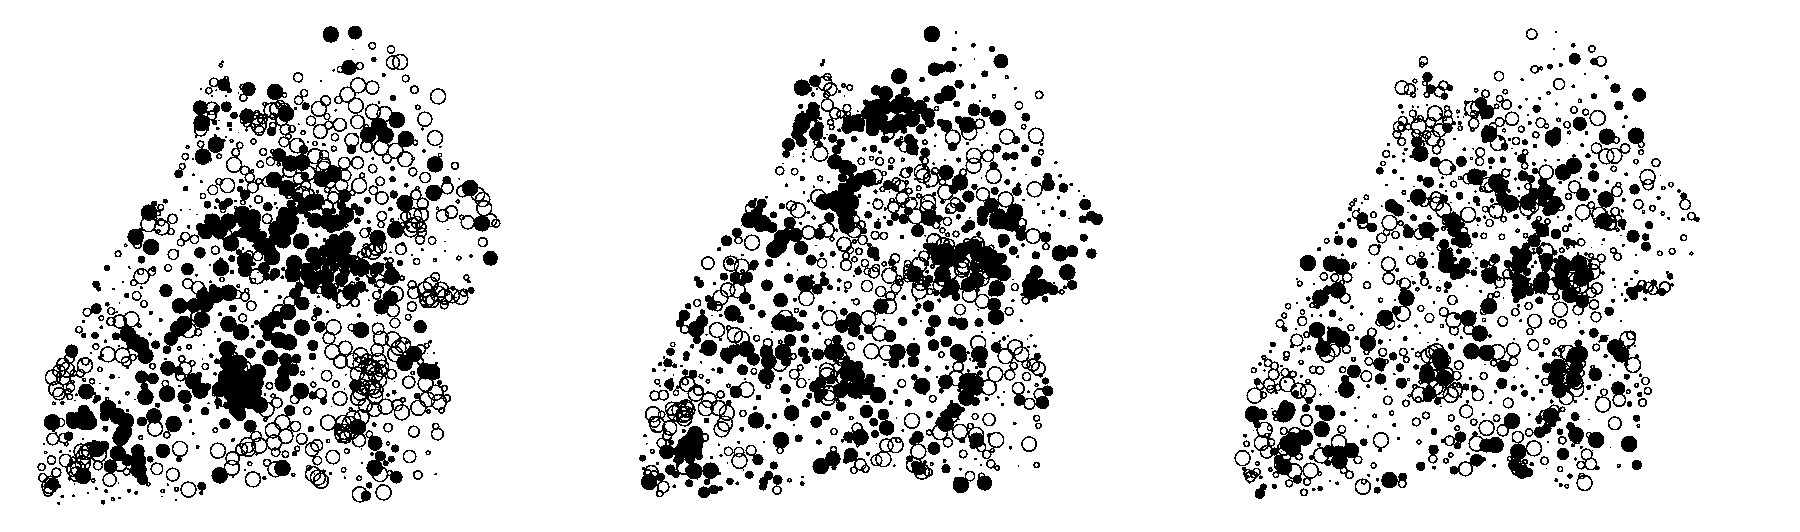
The statistical analysis of the purchasing power in Baden-Württemberg dealt with changes in the relative puchasing power over several periods of time (1987-2004). The focus of this investigation was put on the analysis of spatial correlations using methods for marked point processes, e.g. distance-dependant Simpson indices and the mark correlation function. It was shown that positive correlations exist for small distances between different townships. However, these correlations are becoming weaker over the years until they are almost non-existant. A conclusion from this loss of spatial correlations with time is that the relative purchasing power might become more and more purely random, i.e. the relative purchasing power of a township is less and less influenced by the relative purchasing power of tonwhsips nearby.
Contact persons: Prof. Schmidt and Stefanie Eckel